S&P500 4-hour chart
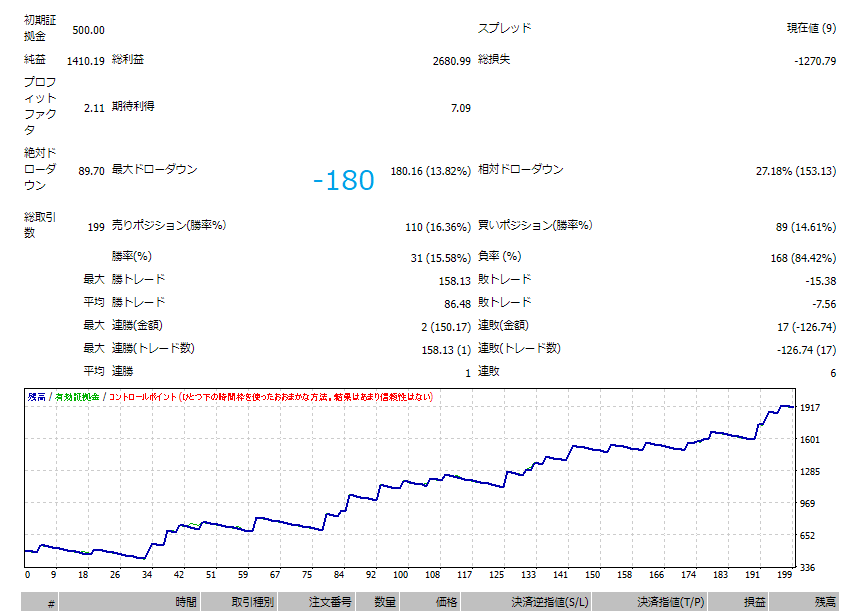
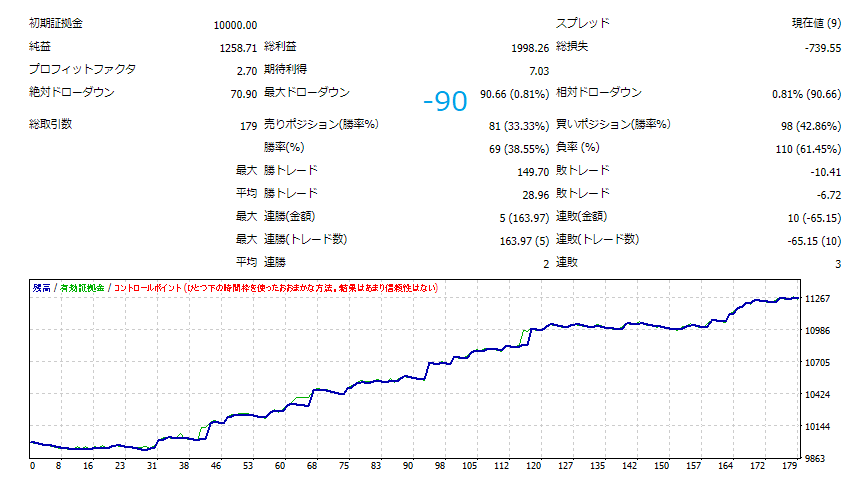
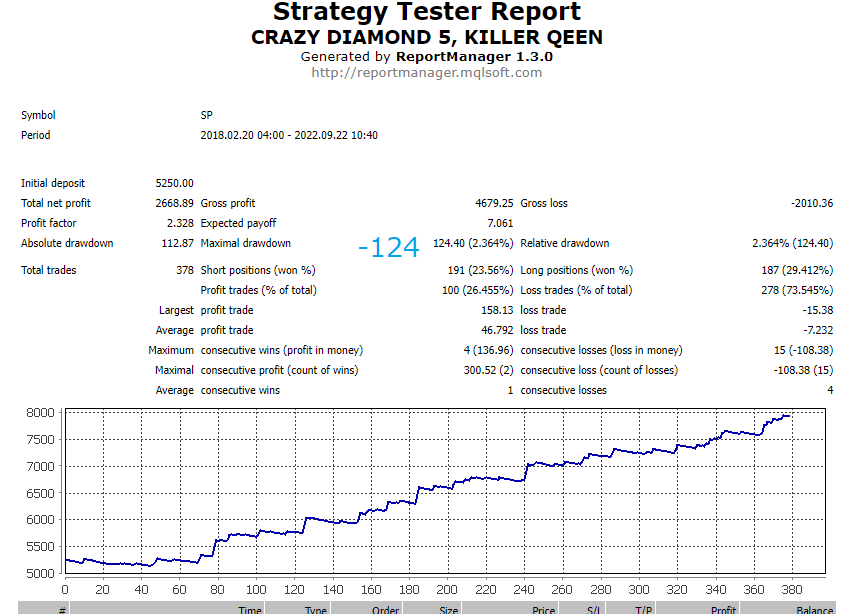
Two optimisations were made by shifting the entry point.
2018.02.20~


The synthesised one had a lower MAXDD.
It seems to have adapted to the downward trend since the beginning of the year.

S&P500 GOLD FX
Two optimisations were made by shifting the entry point.
2018.02.20~


The synthesised one had a lower MAXDD.
It seems to have adapted to the downward trend since the beginning of the year.

Discussion
New Comments
No comments yet. Be the first one!